


Cuts to Right to Buy discounts in 2024 drove spike in applications
Local authorities in England saw their stock of social rented homes decrease by 9,570 between 2025 and 2026.
The reduction was 37% higher than the 6,971 recorded the previous year.
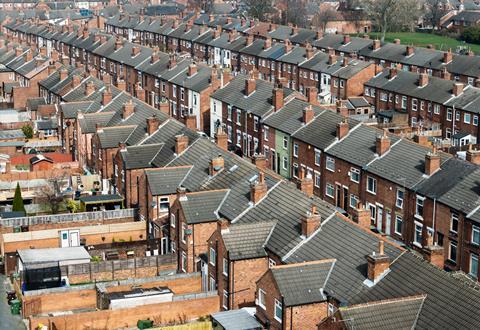
In its latest annual statistics about social housing stock ownership and rents, the Regulator of Social Housing (RSH) said the loss is “likely to be primarily driven by Right to Buy sales and other schemes”.
The loss follows reductions to Right to Buy discounts introduced in November 2024 under the Starmer Labour government.
Meanwhile, private registered providers (PRPs) recorded a net gain of 7,829 social rent homes in 2026.
Returns from all private and local authority landlords showed the social housing sector provides 4.6 million homes across England as of March 2026, with a net increase of around 36,000 social homes since 2025.
Of the 4.6 million units, PRPs own 3 million and councils 1.6 million.
According to RSH, this overall rise has been driven by an increase of over 24,000 in affordable rent homes and 13,390 increase in low-cost home ownership homes. However, there was also a net decrease of just over 1,700 social rent homes.
PRPs, such as housing associations, built, purchased or acquired the majority of new homes in the sector, accounting for 88% of the total increase in affordable rent and 97% for low-cost home ownership properties.
The statistics indicated that 82% of social homes in England are for general needs social and affordable rent, while supported housing makes up 11% and low-cost home ownership 6%.
London has the greatest proportion of registered provider owned homes with 19.4% of all social homes in this area, while the North East has only 5.4% of the overall total.
Birmingham is the local authority area with the largest volume of social housing at just over 107,000 homes.
The average increase in general needs social rent average weekly net rents was 3.2% between 1 April 2025 and 31 March 2026.
The average weekly general needs social rent weekly rent in England for private registered providers was £121.72, though this varied across the country. Average rents were lowest in the North East (£100.31) and highest in London (£154.73).
In this instance, total social housing stock includes general needs social rent, general needs affordable rent, social rent supported housing, affordable rent social housing and low-cost home ownership.







No comments yet