


Net zero group suggests that progress on decarbonising homes in the North is slower
Progress in retrofitting carbon-intensive homes in the North-east, North-west and Yorkshire and the Humber has been slower than in other regions, according to a study by Powering Net Zero.
However, the North-east still has the lowest number of high-carbon homes compared to the rest of England and Wales.
The Powering Net Zero (PNZ) Group has highlighted “a gaping North-South divide” regarding progress in decarbonising homes across England and Wales.
PNZ’s analysis found that in the North-east, the North-west, and Yorkshire and the Humber, 3.1% of homes in 2023 were recorded as ‘high-emissions homes’.
This reveals a 0.3% decrease in the number of carbon-intensive homes in the North of England, which stood at 3.4% in 2010.
PNZ, which launched in September 2023, is a coalition of businesses that fund the decarbonisation of British homes by selling UK-generated carbon credits.
The three businesses that form PNZ are Warrington-based retrofit and renewable energy firms: Arctica Partners, Arete Zero Carbon, and Dynamis Associates.
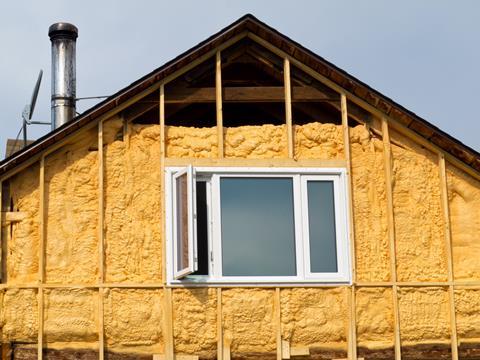
Nearly 700,000 homes in England and Wales are classified as ‘high-emissions homes’, broadly equivalent to EPC ratings of F or G, the two lowest bands for energy efficiency. These homes emit over 100kg of carbon dioxide per square metre, annually, compared with the average home’s 40kg.
>> See also: BRE recommends shake up of EPC ratings to encourage retrofit work
>> See also: Council seeks contractors for £3bn London housing framework
The government has committed to decarbonising all areas of the UK economy to achieve net zero by 2050. Registered providers are retrofitting homes to reach EPC C by 2030.
In the North-east, 2.37% of its homes were classified as high-emissions in 2010, in 2015 this dropped 2.26% and went back up to 2.37% in 2023.
As it stands, the North-east has a total of 27,850 high-emissions homes, the lowest figure out of the regions in England and Wales.
In the North-west and Yorkshire, there was a less than 0.5% reduction in high-emissions homes since 2010. Yorkshire and the Humber, and the North-west have 94,368 and 95,881 high-emissions homes respectively.
The South-west had the highest proportion of emissions-intensive homes of all regions across England and Wales in 2010, at 6.5%. The proportion of high-emissions homes in the South-west has dropped to 3.7% in 2023, the largest decrease out of all the regions.
As of 2023, the South-west had a total of 89,506 high-emissions homes.
Simon Turek, co-founder at the PNZ Group, said, of the findings: “Our data analysis tells the story of a huge regional divide in improving the UK’s housing stock, where Northern England has been left behind.
”Making UK homes –– particularly the most carbon intensive –– more energy efficient is a huge hurdle to reaching net zero emissions by 2050. Government retrofitting schemes cover some ground, but the scale of funding needed to green our homes means we need private sector investment too.
”PNZ Group, as a North West-based business, is uniquely committed to bridge this yawning regional gap, and nearly 40% of our domestic retrofit projects are in the North of England to help deliver warmer, greener homes with urgency.”
PNZ Group’s data on the number of high-emissions homes (HEH) by region
| Region | % of HEH in 2010 | % of HEHin 2015 | % of HEH in 2023 | 2010-15decrease (pp) | 2015-23decrease (pp) | 2010-23 decrease (pp) | Total number of homes | Number of HEH in each region |
|---|---|---|---|---|---|---|---|---|
| South-west | 6.47% | 4.52% | 3.68% | 1.95 | 0.84 | 2.79 | 2,430,252 | 89,506 |
| South-east | 3.7% | 2.55% | 1.92% | 1.15 | 0.63 | 1.78 | 3,782,722 | 72,606 |
| East Midlands | 4.61% | 3.35% | 2.95% | 1.26 | 0.40 | 1.65 | 2,027,713 | 59,868 |
| East | 4.03% | 3.08% | 2.47% | 0.95 | 0.60 | 1.56 | 2,612,641 | 64,640 |
| Wales | 6.18% | 4.61% | 4.78% | 1.57 | -0.17 | 1.40 | 1,342,745 | 64,140 |
| West Midlands | 4.25% | 3.24% | 2.86% | 1.01 | 0.38 | 1.39 | 2,419, 770 | 69,283 |
| London | 2.78% | 2.20% | 1.53% | 0.58 | 0.67 | 1.25 | 3,419,484 | 52,250 |
| Yorkshire and the Humber | 4.49% | 3.85% | 4.06% | 0.64 | -0.21 | 0.43 | 2,324,873 | 94,368 |
| North-west | 3.32% | 3.26% | 3.05% | 0.07 | 0.21 | 0.28 | 3,144,467 | 95,881 |
| North-east | 2.37% | 2.26% | 2.37% | 0.11 | -0.11 | 0.00 | 1,174,266 | 27,850 |
| England and Wales | 4.22% | 3.29% | 2.97% | 0.93 | 0.32 | 1.25 | 24,678,933 | 690,393 |


No comments yet